Technology
Mapping the Biggest Tech Talent Hubs in the U.S. and Canada
Mapping the Biggest Tech Talent Hubs in the U.S. and Canada
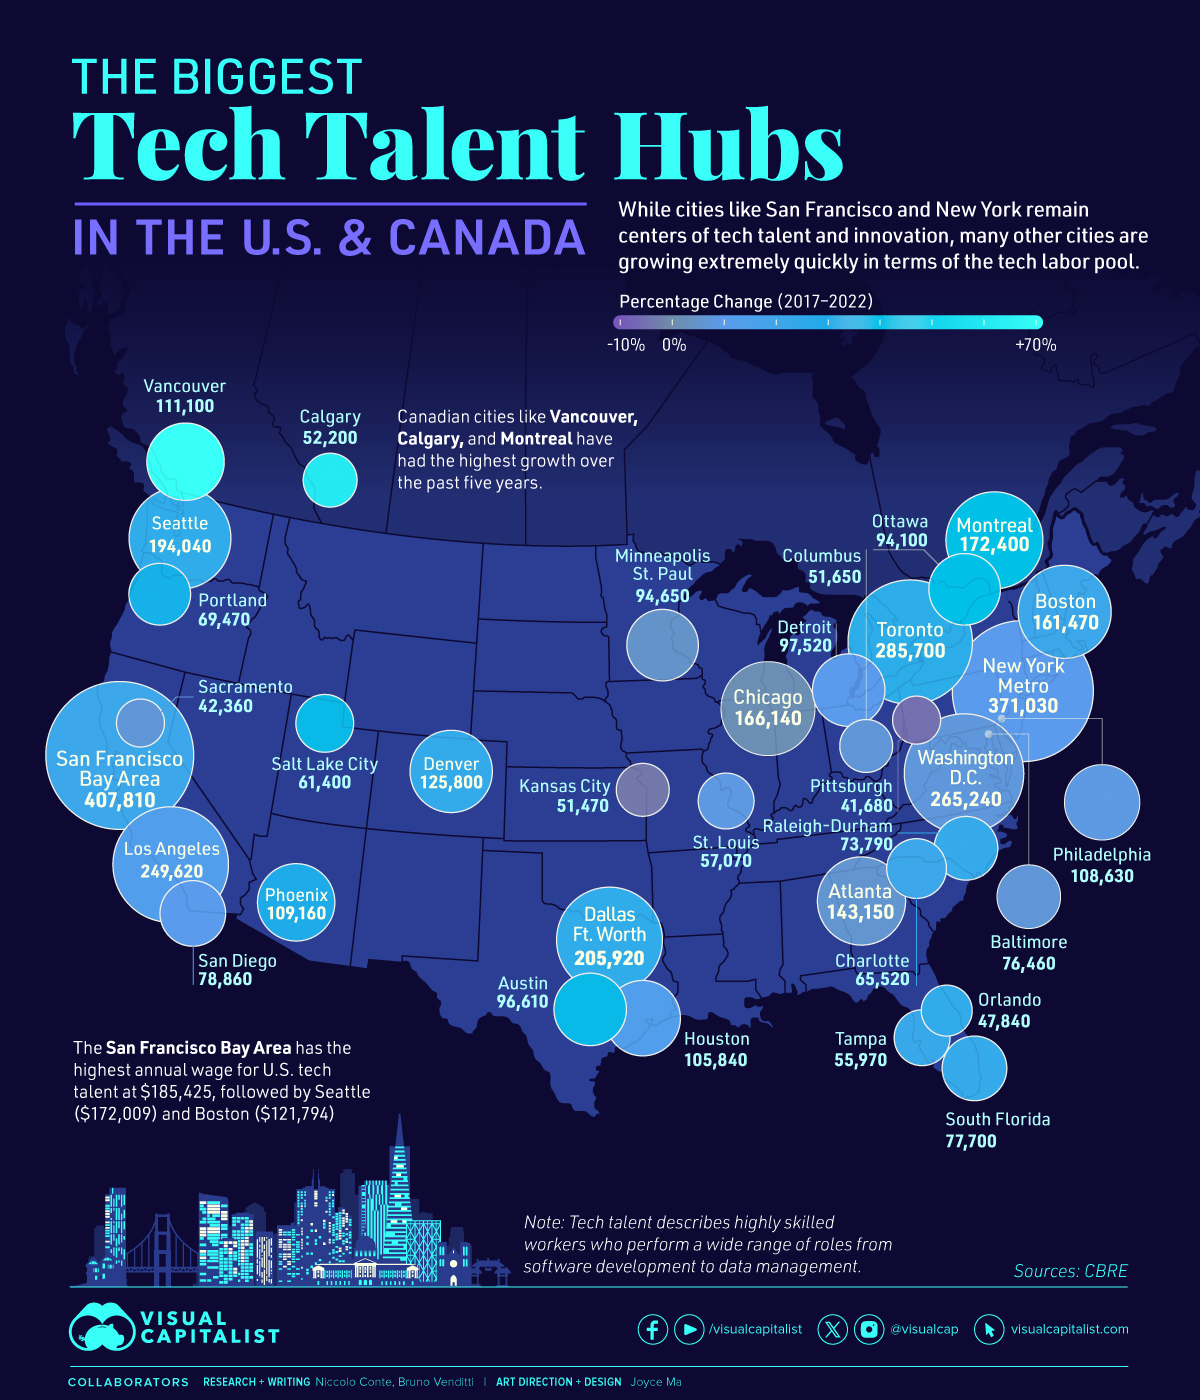
While cities like San Francisco and New York remain centers of tech talent and innovation, many other cities are growing extremely quickly in terms of the tech labor pool.
This infographic draws from a report by CBRE to determine which tech talent markets in the U.S. and Canada are the largest. The data looks at the total workforce in the sector, as well as the change in tech worker population over time in various cities.
What is Tech Talent?
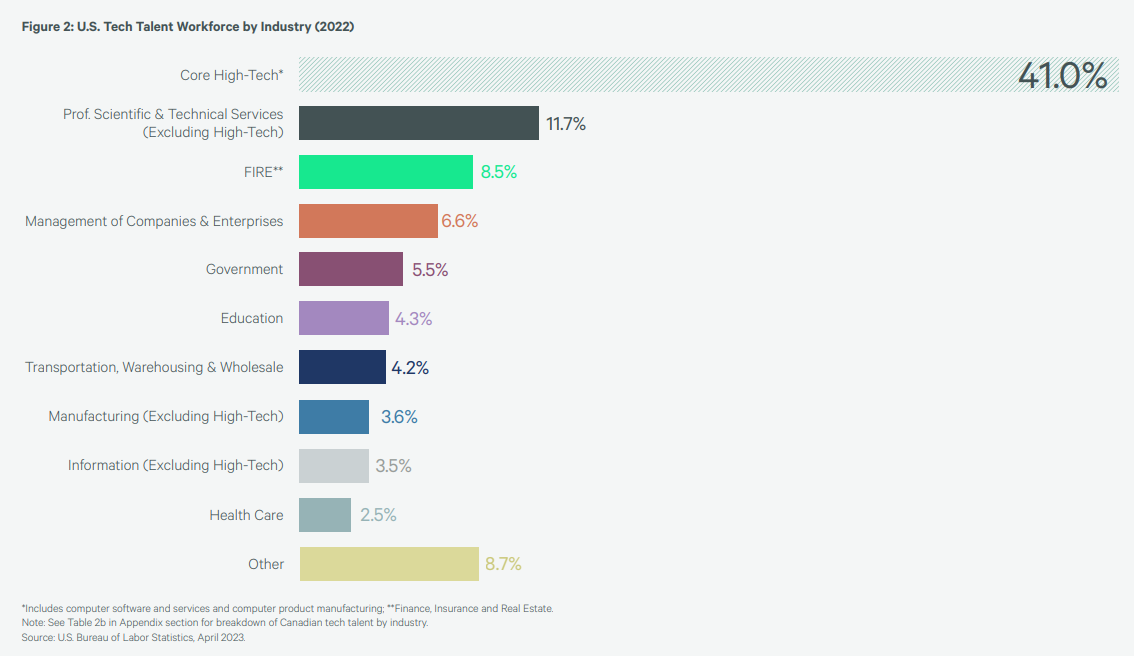
Tech talent represents a group of highly skilled workers in more than 20 technology-oriented occupations driving innovation across all industry sectors, ranging from software developers to systems and data managers.
Although these positions are concentrated within the high-tech industry, they are spread across all industry sectors.
Top tech talent markets are typically characterized by a substantial level of educational attainment and a significant concentration of young individuals. Forty-five of the top 50 talent markets have an educational attainment level above national averages.
The tech sector remains one of the top employers of highly skilled workers in North America, with over seven million workers.
California’s Bay Area, which includes Silicon Valley, remains the biggest tech hub, with a talent pool of 407,810 tech workers, compared to 378,870 in 2021.
| Market | Tech Workforce (2022) | Change (2017-2022) |
|---|---|---|
| San Francisco Bay Area | 407,810 | 23% |
| New York Metro | 371,030 | 11% |
| Toronto | 285,700 | 29% |
| Washington D.C. | 265,240 | 7% |
| Los Angeles/Orange County | 249,620 | 17% |
| Dallas/Ft. Worth | 205,920 | 28% |
| Seattle | 194,040 | 29% |
| Montreal | 172,400 | 43% |
| Chicago | 166,140 | 2% |
| Boston | 161,470 | 22% |
| Atlanta | 143,150 | 6% |
| Denver | 125,800 | 26% |
| Vancouver | 111,100 | 69% |
| Phoenix | 109,160 | 30% |
| Philadelphia | 108,630 | 7% |
| Houston | 105,840 | 12% |
| Detroit | 97,520 | 10% |
| Austin | 96,610 | 39% |
| Minneapolis/St.Paul | 94,650 | 4% |
| Ottawa | 94,100 | 40% |
| San Diego | 78,860 | 12% |
| South Florida | 77,700 | 24% |
| Baltimore | 76,460 | 5% |
| Raleigh-Durham | 73,790 | 24% |
| Portland | 69,470 | 34% |
| Charlotte | 65,520 | 21% |
| Salt Lake City | 61,400 | 39% |
| St. Louis | 57,070 | 7% |
| Tampa | 55,970 | 23% |
| Calgary | 52,200 | 61% |
| Columbus | 51,650 | 5% |
| Kansas City | 50,470 | -4% |
| Orlando | 47,840 | 26% |
| Sacramento | 42,360 | 7% |
| Pittsburgh | 41,680 | -6% |
| Cincinnati | 40,450 | 10% |
| Nashville | 39,180 | 36% |
| Cleveland | 38,130 | 6% |
| Quebec City | 36,400 | 34% |
| Indianapolis | 35,980 | 1% |
| Milwaukee | 35,260 | 14% |
| San Antonio | 33,470 | 7% |
| Virginia Beach | 31,210 | 17% |
| Edmonton | 31,100 | 45% |
| Waterloo Region, Canada | 29,700 | 52% |
| Richmond | 28,480 | 14% |
| Hartford | 27,500 | 6% |
| Inland Empire | 26,850 | 44% |
| Jacksonville | 23,620 | 17% |
| Madison | 23,530 | 45% |
The Bay Area also has the highest annual wage for U.S. tech talent at $185,425, followed by Seattle ($172,009) and Boston ($121,794)
Toronto remains the third tech hub in North America, just behind the San Francisco Bay Area and New York.
Emerging Tech Cities in Canada
Canada has attracted significant numbers of tech workers largely as a result of the country’s immigration-friendly national policy and labor cost advantage, according to a recent report from the Technology Councils of North America (TECNA) and Canada’s Tech Network (CTN).
In fact, Canadian cities like Vancouver, Calgary, and Waterloo have had the highest growth of tech workers over the past five years.
Between April 2022 and March 2023, 32,115 new workers came to Canada with the most migrating from India and Nigeria.
North America’s Next Tech Hubs
Despite the dominance of traditional tech hubs, the report also points to other cities that could receive tech talent over the next few years.
They are concentrated in the U.S. Midwest and South, like Boise (ID), Las Vegas (NE), Palm Bay (FL), and Birmingham (AL).
The report also highlights Winnipeg and Halifax as potential Canadian tech hubs.


Technology
Countries With the Highest Rates of Crypto Ownership
While the U.S. is a major market for cryptocurrencies, two countries surpass it in terms of their rates of crypto ownership.


Countries With the Highest Rates of Crypto Ownership
This was originally posted on our Voronoi app. Download the app for free on iOS or Android and discover incredible data-driven charts from a variety of trusted sources.
This graphic ranks the top 10 countries by their rate of cryptocurrency ownership, which is the percentage of the population that owns crypto. These figures come from crypto payment gateway, Triple-A, and are as of 2023.
Data and Highlights
The table below lists the rates of crypto ownership in the top 10 countries, as well as the number of people this amounts to.
| Country | % of Population Who Own Crypto | # of Crypto Owners |
|---|---|---|
| 🇦🇪 United Arab Emirates | 30.4 | 3M |
| 🇻🇳 Vietnam | 21.2 | 21M |
| 🇺🇸 U.S. | 15.6 | 53M |
| 🇮🇷 Iran | 13.5 | 12M |
| 🇵🇭 Philippines | 13.4 | 16M |
| 🇧🇷 Brazil | 12 | 26M |
| 🇸🇦 Saudi Arabia | 11.4 | 4M |
| 🇸🇬 Singapore | 11.1 | 665K |
| 🇺🇦 Ukraine | 10.6 | 4M |
| 🇻🇪 Venezuela | 10.3 | 3M |
Note that if we were to rank countries based on their actual number of crypto owners, India would rank first at 93 million people, China would rank second at 59 million people, and the U.S. would rank third at 52 million people.
The UAE Takes the Top Spot
The United Arab Emirates (UAE) boasts the highest rates of crypto ownership globally. The country’s government is considered to be very crypto friendly, as described in Henley & Partners’ Crypto Wealth Report 2023:
In the UAE, the Financial Services Regulatory Authority (FSRA-ADGM) was the first to provide rules and regulations regarding cryptocurrency purchasing and selling. The Emirates are generally very open to new technologies and have proposed zero taxes for crypto owners and businesses.
Vietnam leads Southeast Asia
According to the Crypto Council for Innovation, cryptocurrency holdings in Vietnam are also untaxed, making them an attractive asset.
Another reason for Vietnam’s high rates of ownership could be its large unbanked population (people without access to financial services). Cryptocurrencies may provide an alternative means of accessing these services without relying on traditional banks.
Learn More About Crypto From Visual Capitalist
If you enjoyed this post, be sure to check out The World’s Largest Corporate Holders of Bitcoin, which ranks the top 12 publicly traded companies by their Bitcoin holdings.

-

 Markets6 days ago
Mapped: Europe’s GDP Per Capita, by Country
-

 Energy2 weeks ago
Mapped: The Age of Energy Projects in Interconnection Queues, by State
-

 Mining2 weeks ago
Visualizing Global Gold Production in 2023
-

 Markets2 weeks ago
Visualized: Interest Rate Forecasts for Advanced Economies
-

 Economy2 weeks ago
The Most Valuable Companies in Major EU Economies
-

 Markets1 week ago
The World’s Fastest Growing Emerging Markets (2024-2029 Forecast)
-

 Markets1 week ago
Visualizing Global Inflation Forecasts (2024-2026)
-

 United States1 week ago
Charted: What Southeast Asia Thinks About China & the U.S.